Technical TL;DR
The proposed STaRFormer framework introduces dynamic attention-based regional masking and a novel semi-supervised contrastive learning scheme to create robust task-informed latent embeddings, enhancing the model's robustness to irregularities in time series. This approach can additional serves as an effective augmentation method to improve performance for various time series types (including non-stationary and irregularly sampled), domains and downstream tasks.
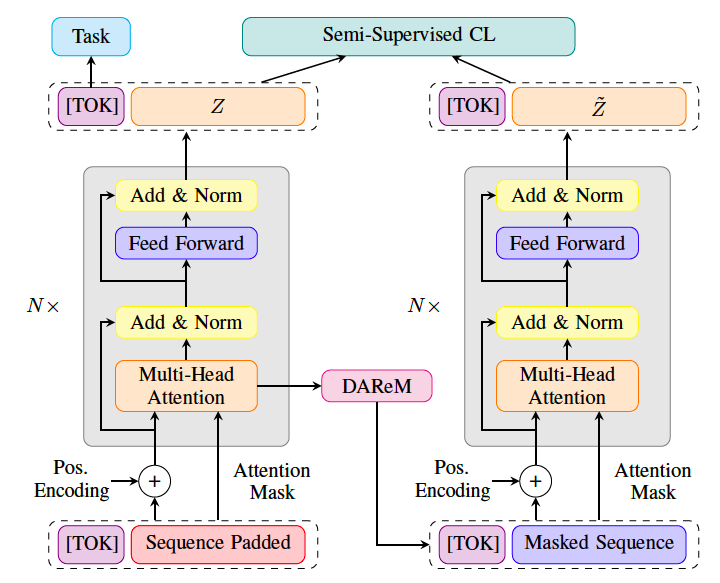
STaRFormer Architecture
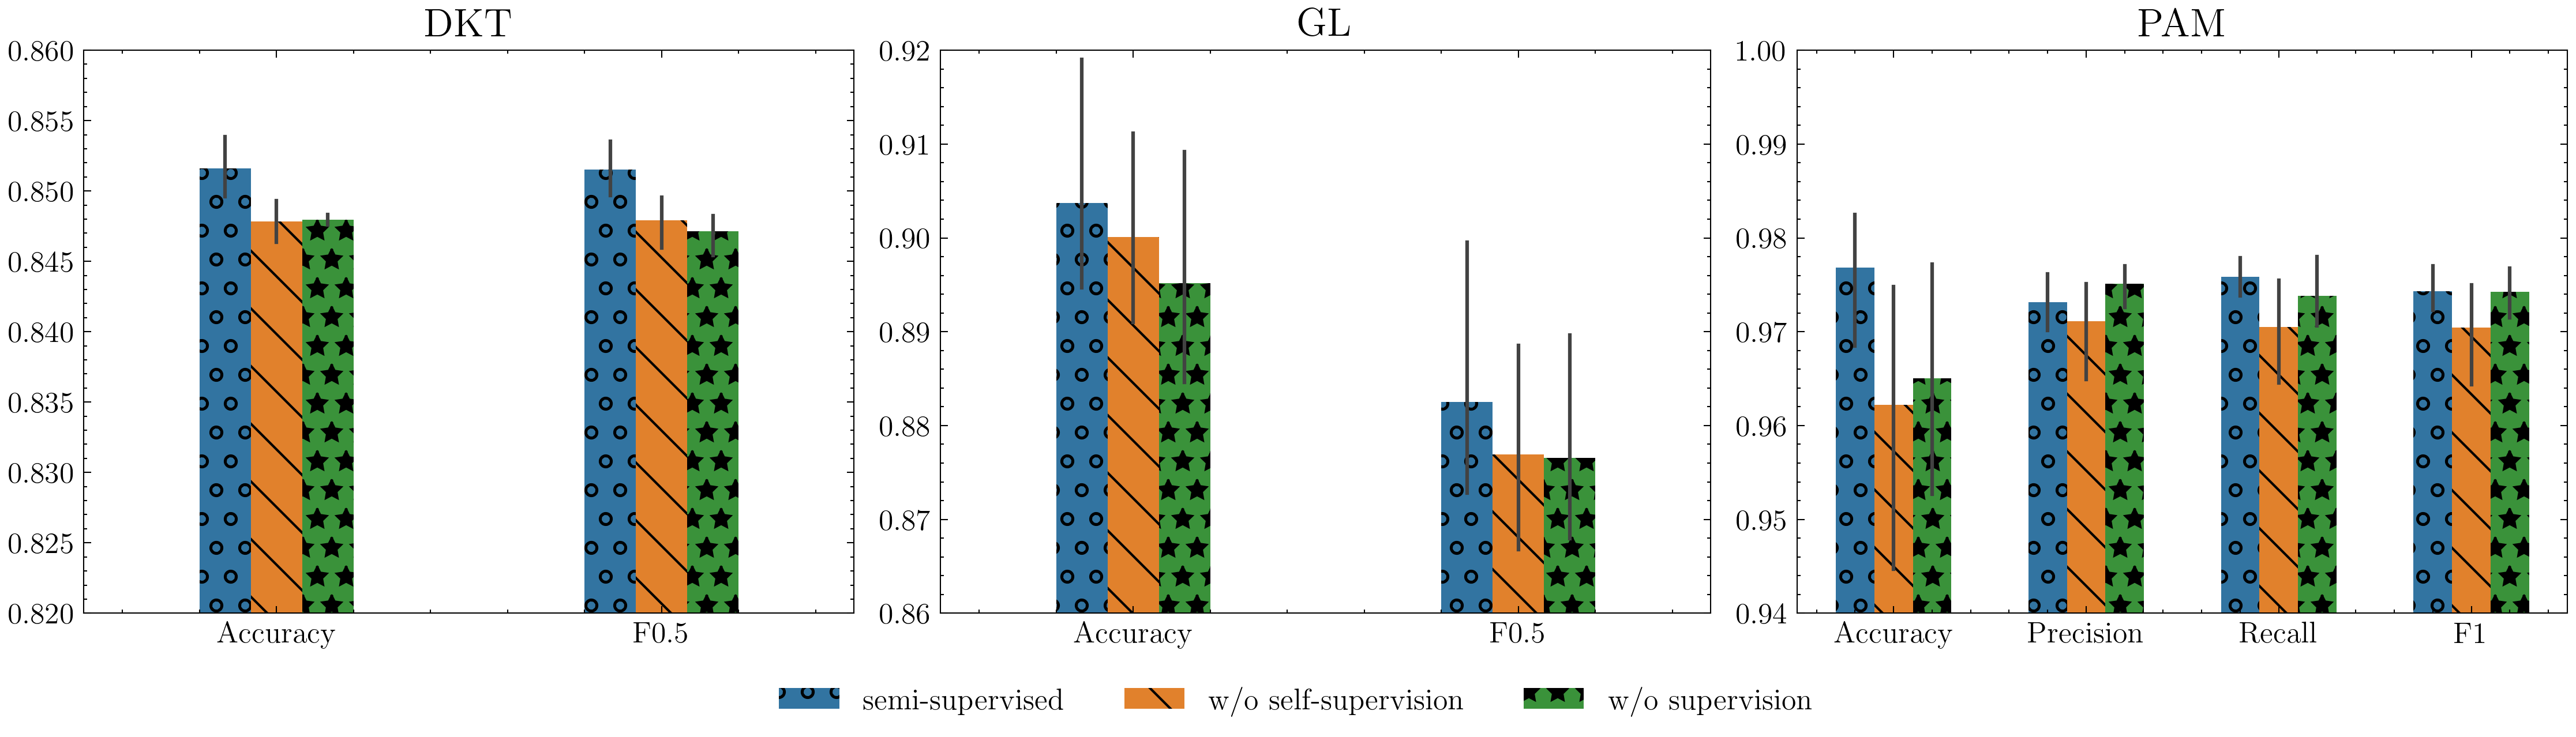
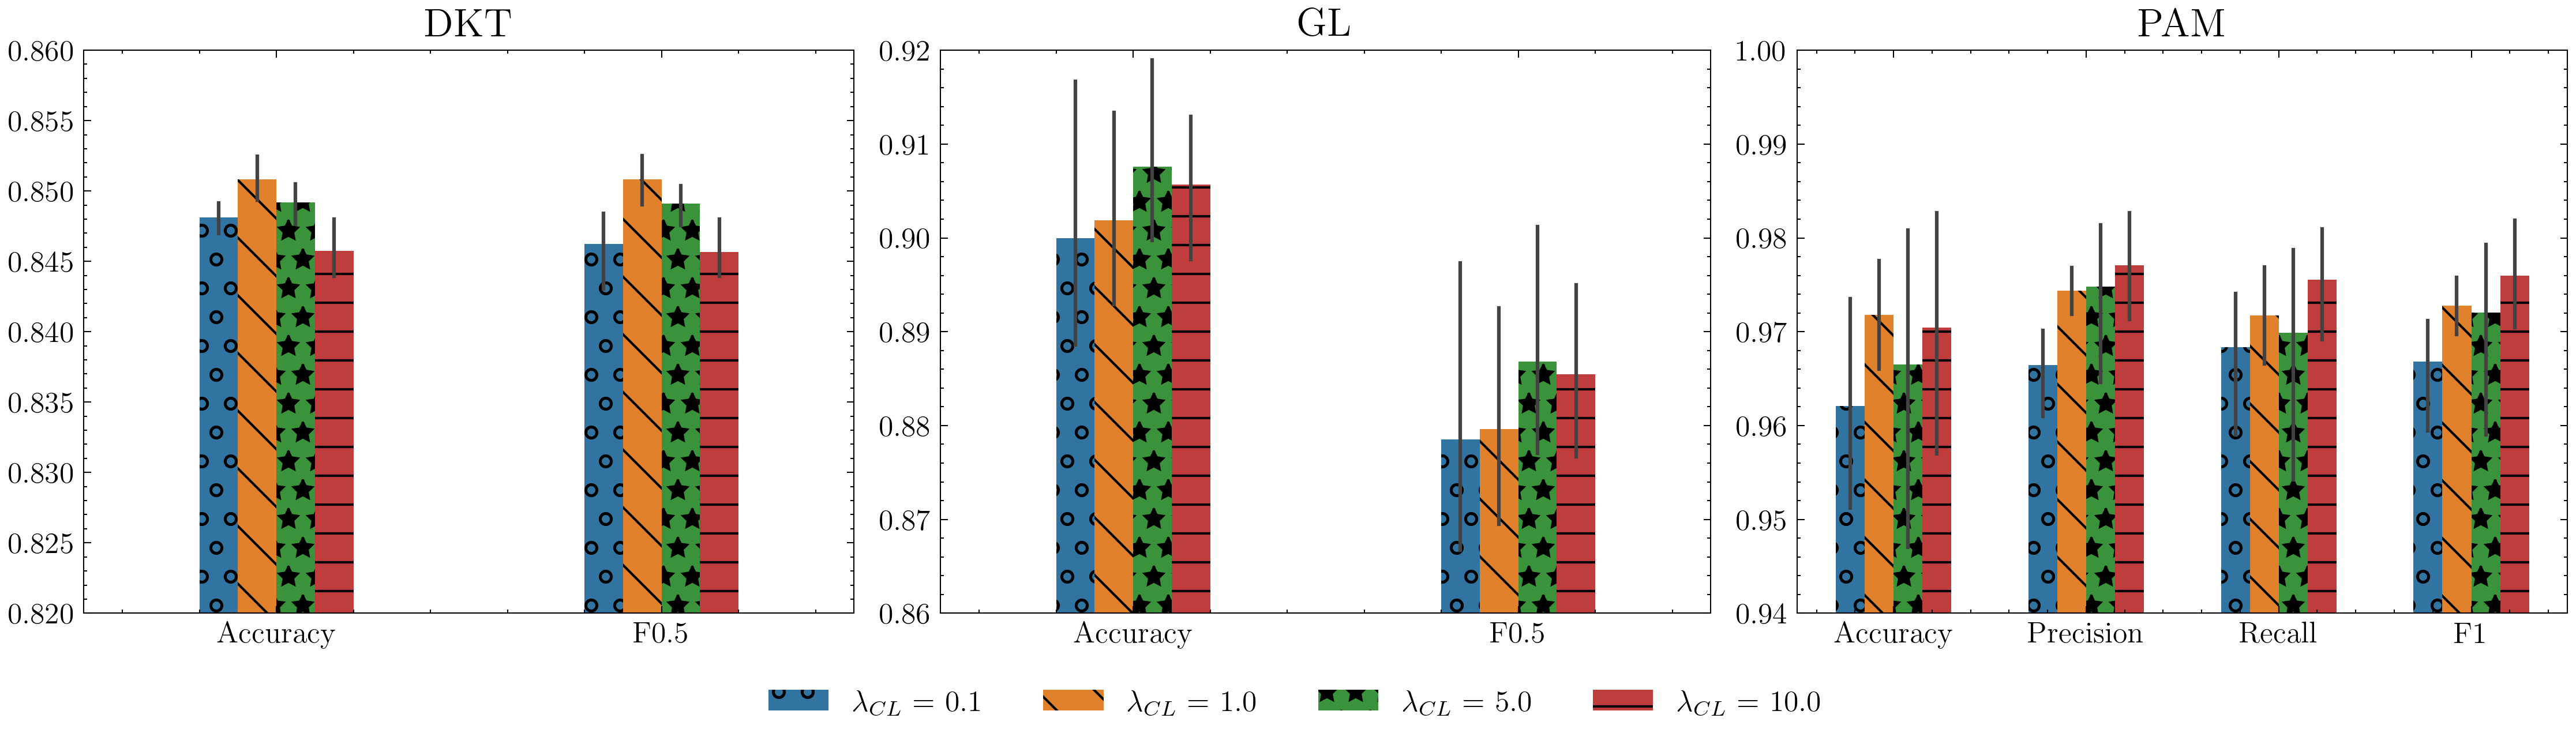
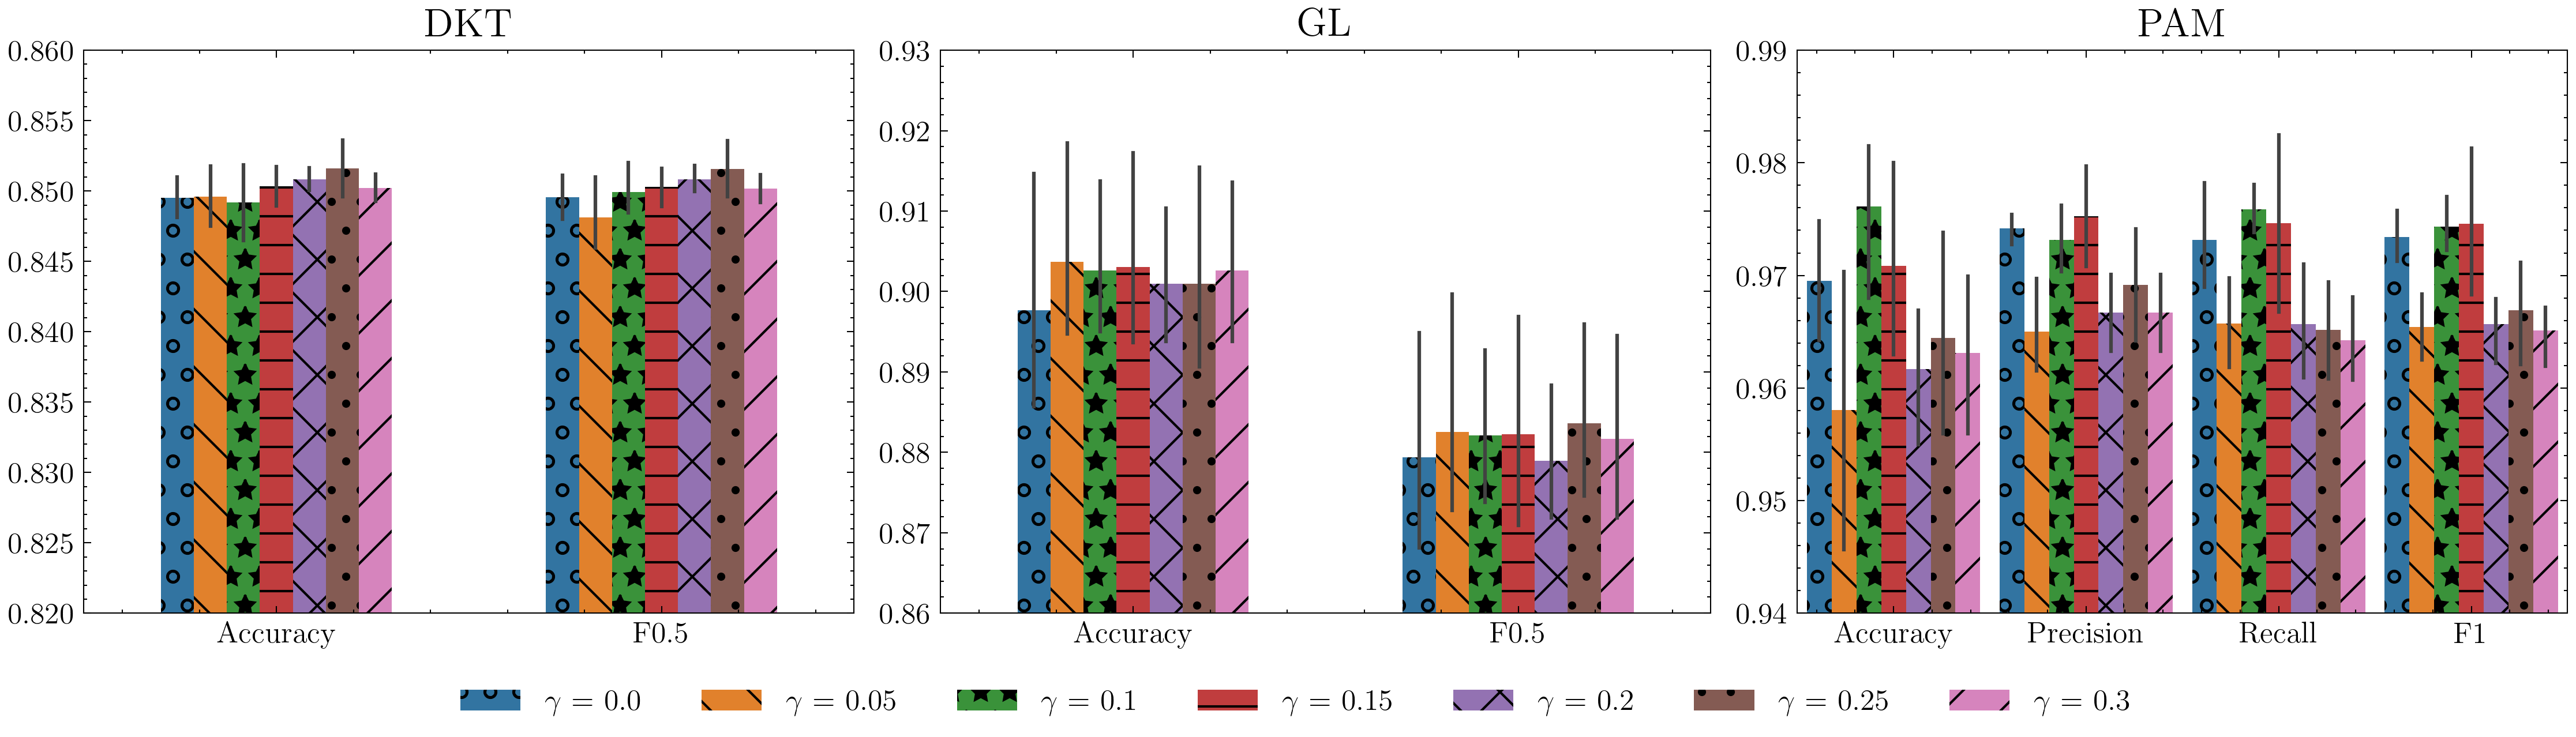
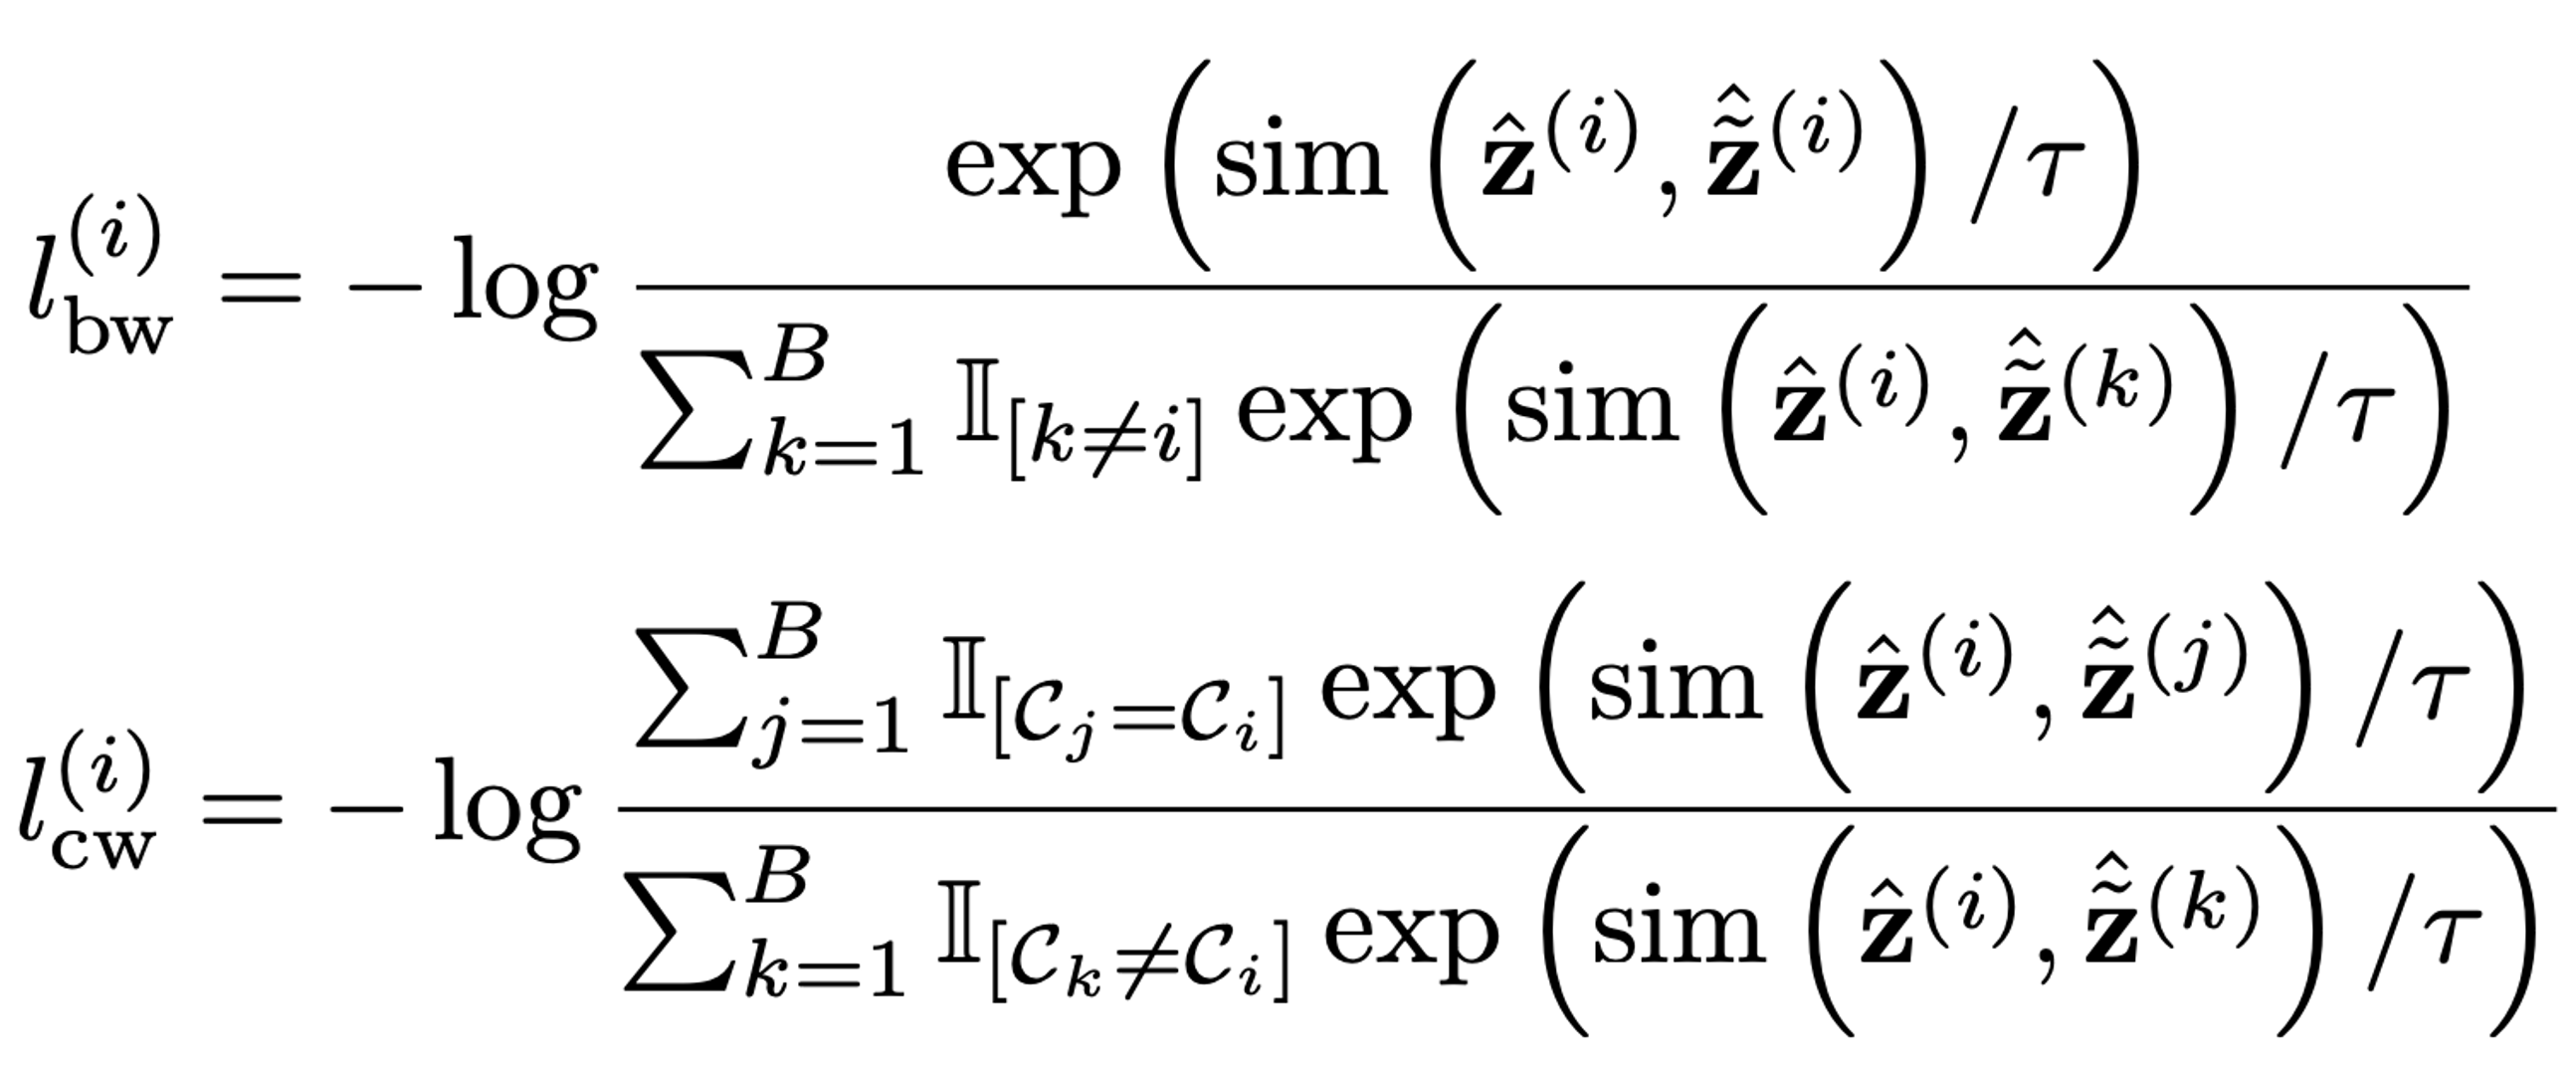
Semi-Supervised Contrastive Learning Components
I. Formulation for sequence-level prediction tasks
Composition of batch-wise (bw) and class-wise (cw) contrastive components.
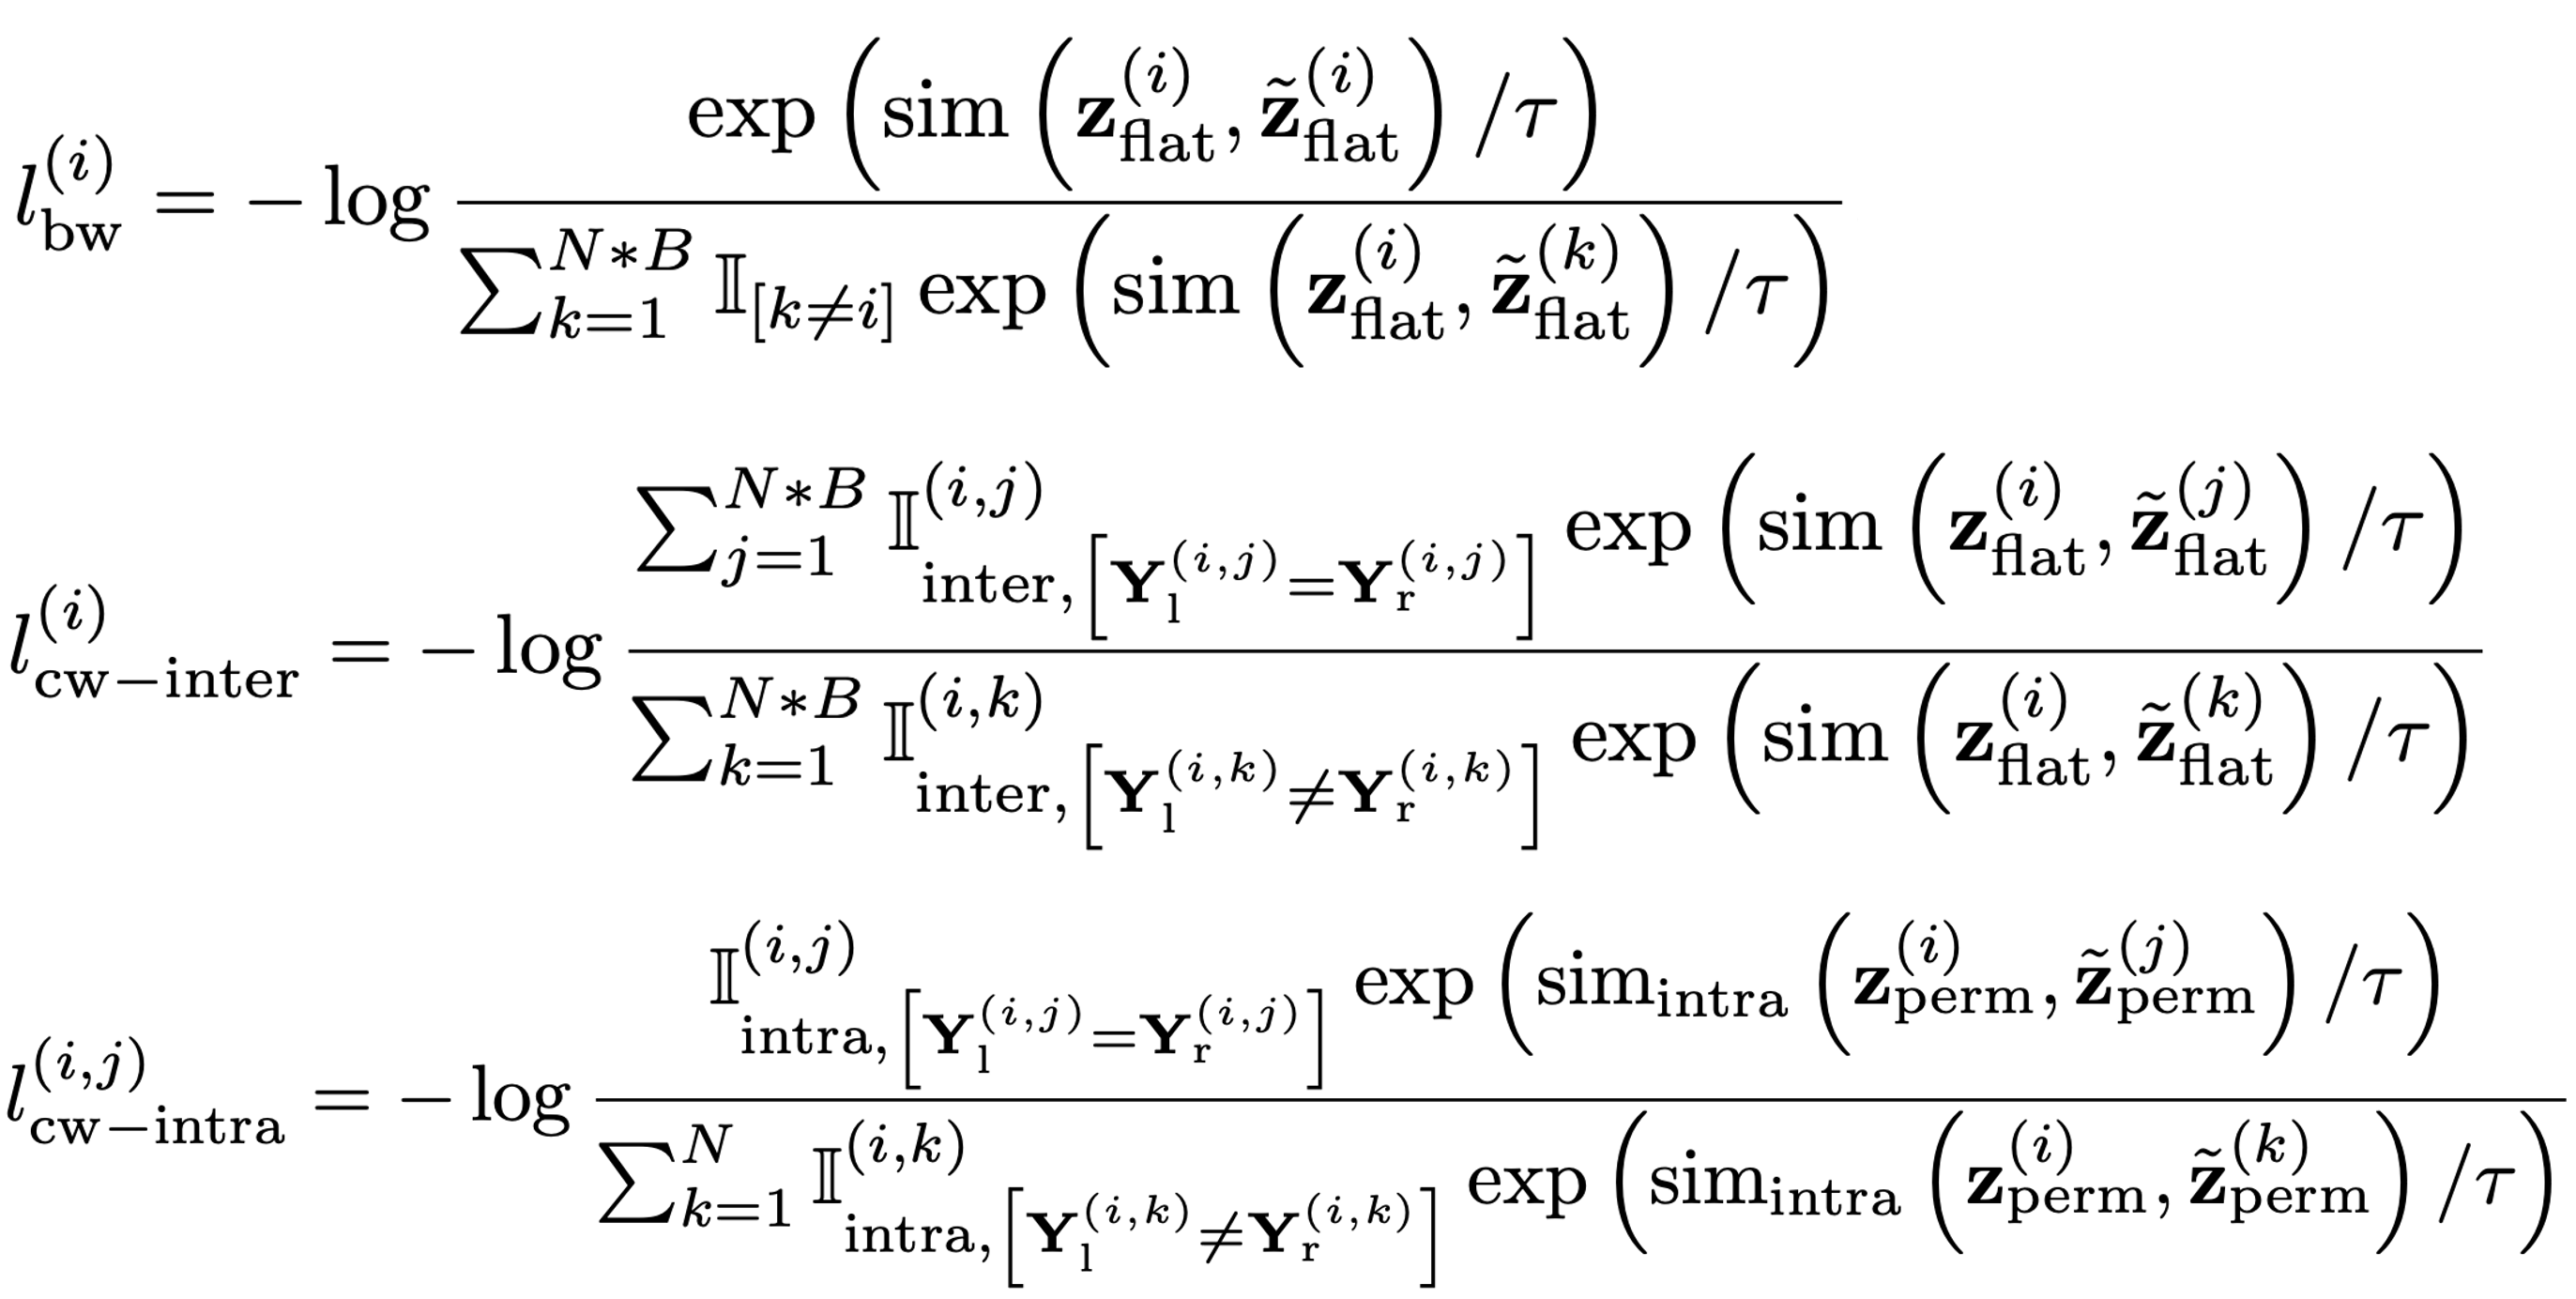
II. Formulation for elementwise-level prediction tasks
Composition of batch-wise (bw), intra-class-wise (cw-intra) and inter-class-wise (cw-inter) contrastive components.